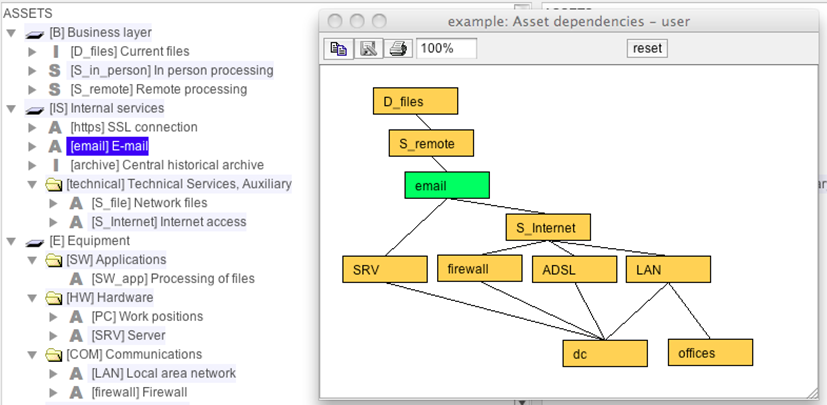
The graph shows the relationships between assets. It only presents the assets related to those selected on the main screen, or all the assets if nothing is selected.
Assets are heuristically positioned so that there is no relation going upwards: all dependencies go from top to bottom. However, if the picture is unpleasant, the user may reposition assets as desired (drag and drop on boxes).
The graph tracks the selection on the main dependencies screen. So, if you select an asset, a group or a layer, only the assets in the group and those direct or indirectly linked will appear in the picture.
|
|
copy |
Copies the image to the note pad to paste it somewhere else. |
|
|
save |
to store the picture as an image file. The available image formats depend on the hosting machine; some formats are quite widespread: jpg, jpeg, png |
|
|
print |
to send the picture to a printer |
|
|
scale |
to enlarge / decrease the image |
|
|
reset |
repositions boxes to initial places (heuristic) |
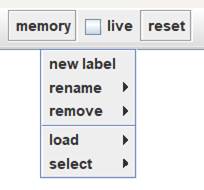
Graph screens present a
MEMORY push-down menu to record diagrams with a name
|
new label |
define a new label with a
name |
|
rename |
rename a label |
|
remove |
remove a label |
|
load |
current diagram is saved
under the given label |
|
select |
saved (loaded) diagram is
recovered |